Car Body Construction with zenon

With its cross-technology concept, the zenon software platform is a powerful solution for production monitoring of the body construction in automotive manufacturing. Find out how zenon brings transparency to production and creates conditions for greater efficiency.
What challenges do car manufacturers face in car body construction?
The construction of car bodies is a complex and involved process due to balancing efficiency and performance with safety. By automating the process using a tool like zenon, manufacturers can ensure that issues like downtime and energy expenditure are constantly monitored and improved without any safety and performance tradeoffs.
A car body production line consists of many production cells, each of which produces a part of the body. Although all equipment has the same basic technology components, the individual equipment is optimized for the body components it produces in order to enable a significantly higher production volume and automation. A floor group system, for example, cannot produce side parts.
Downtime in one section can delay the completion of a full car body, and lead to excess energy expenditure If there were to be an error in one part of the production line, it may throw off the carefully planned production schedule. For this reason, the control and monitoring of both the individual equipment and the network of all systems is essential to the effectiveness of production.
The advantages of zenon as software platform for efficient car body production
The zenon software platform is ideal for production monitoring that integrates all technologies. Thanks to the comprehensive standardization of software components and interfaces, production data becomes transparent. One factor here is the option for supra-production monitoring, for optimal utilization of the available systems and transport routes. The energy required for production can also be taken into account. Corresponding analysis enables the intelligent direction of further optimization.
When changing the vehicle model, process experts can define the required zenon standard modules before the start of production (SOP), which greatly shortens the engineering and commissioning periods.
During ongoing production, these modules ensure smooth operation and support the staff with standardized functionalities in the event of a fault or maintenance. In addition, work orders can be moved flexibly between equipment or production sites. Clocked flow production is linked to the concept of flexible workstations. When changing models or expanding these modules, only the relevant capsule needs to be expanded functionally.
The high scalability of zenon allows it to be used at all levels of production monitoring and control. Depending on the task, users are provided with information tailored to their needs. Data is exchanged internally using standardized and encrypted messages. A connection to a production control system or a quality system is possible with OPC UA, SQL or proprietary interfaces.
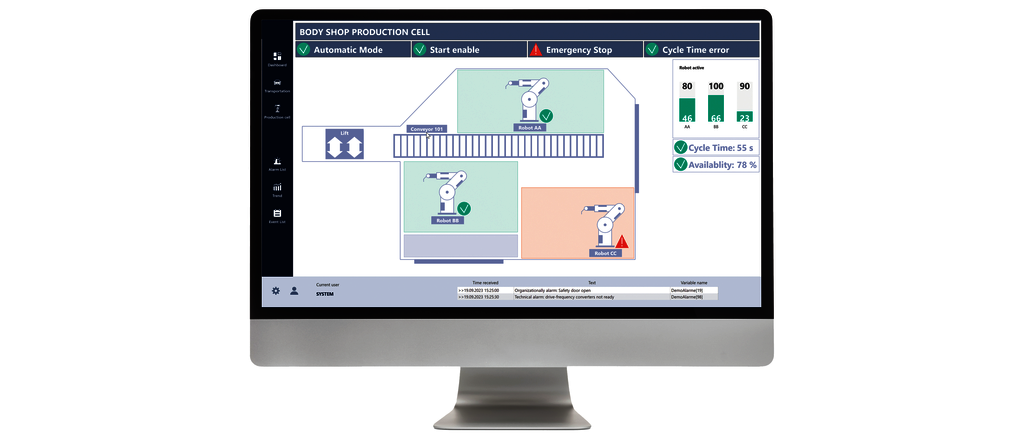
Cycle time is the heartbeat of production
The individual production cells in the car body construction process produce the different modules of the vehicle body. The cycle time defines the production time of the individual components and the transport between equipment units. The cycle time sets the pace of production in body construction and it is one of the most important variables in production control. As a result, it has to be monitored. If the cycle time of an equipment unit is not observed over time, the linked equipment upstream and downstream in the production line can be affected negatively.
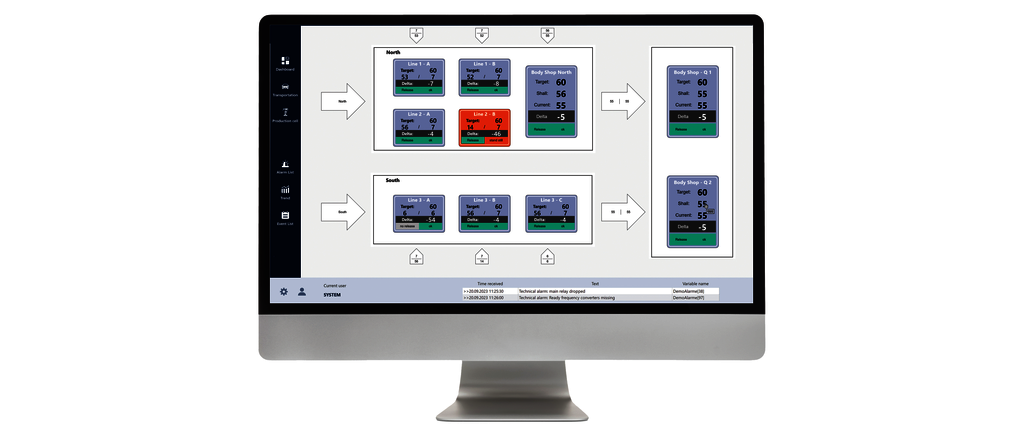
When cycle time violations occur, zenon can respond automatically and notify equipment stages upstream and downstream via large screen displays or ANDON boards. Measures to stabilize the cycle time are initiated. For example, set values can be modified or new cycle times specified for the systems affected.
Subsequent evaluations of the recorded cycle times and cross-equipment comparisons using the corresponding zenon reports enable a "weak point analysis" of the systems and make it possible to identify potential for improvement.

Reduced downtime with zenon alarm management
zenon alarm processing is used to process faults and messages. This lists all messages, alarms and faults in a sorted list. Multiple filter options enable searches for specific online alarms, historical alarms, unacknowledged alarms, pending alarms, area, group, cause, tag name, identifier, limit text, and time filters.
The contents of the list and the filter options can be predefined for specific tasks. Extensive filter options are available for an optimal analysis of the faults and messages classified. These filters can be saved in user-specific profiles and reused.
All messages can be divided into different categories. Alarm classes and alarm groups enable the logical grouping of alarms and support prioritization and classification. zenon alarm groups are used to differentiate between production areas. Alert classification assigns priorities for customized responses based on the severity or urgency of the alert. For example, the classes “Technology”, “Logistics”, and “Production” are used.
Each group or class can be assigned a name, number, color and function. These classifications make it easier to filter and quickly find the alarm reference. The class color is used as text or background color to better organize the alarm lists.
Each message in the alarm list has a limit text. This can be switched online to a desired user language. A dynamic limit text allows users to insert current values or edit the limit text.
Alarm tracking
Alarm tracking allows alarms that have occurred to be tracked from the overview screens to the equipment area screens. If an alarm occurs in an equipment area, for example, in a production cell, the corresponding screen element is highlighted in color. When the operator selects this item on the screen, the system switches to the related detail screen.
In this way, the system graphically navigates the operator through the screens. It constantly increases the level of detail of the display: from the overview screen to the equipment screen, to the alarm message list with plain text display.
Statistical evaluations of faults and messages
With statistical evaluations of the alarm data, weak points in the equipment or locations can be localized, displayed, and permanently removed.
Various analytic and filter options are available for analyzing the alarms, for example, the summary list and the statistics list. The summary list contains area, group, and cause-related faults as well as individual faults. The statistics list provides information about alarms, including the most frequent, the last, the longest, and the shortest alarms in relation to the downtime and the total fault duration of a system. The number N of the listed alarms is freely selectable.
Efficient and accurate body and component tracking
In car body construction, the bodies and body parts are transported to the individual production cells using conveyor technology. To properly carry out the work steps at the different stations and optimize overall efficiency, the individual positions in the production flow have to be identified through car body tracking.
This is performed using identification modules (RFID, barcode, etc.) on the car bodies. These are carried along with the car body throughout the entire production process to allow for identification at automatic reading stations at any time. The data from this process is stored in a database, evaluated by zenon, and can be displayed in the factory layout or in a detail screen.
With an integrated search function, the current positions of car bodies can be determined quickly and reliably. As a result, you can easily track history and progress within the material transport process.
The seamless integration of car body tracking enables the linking of the stored production information and master data with the faults, messages, and process values that have occurred for further evaluations. In this way, availability, cycle time of the production stations, and throughput times can be calculated. For example, it is possible to determine the shift-related cycle times of the respective production stations, the required processing and transport times, as well as the shift-related downtime with production run losses.
In a conveyor system, decisions have to be made at multiple points on the route along which a car body could potentially be transported. As a rule, these decisions are made automatically by stored timetables.
In some cases – for example, quality control or post-processing – it is necessary to change the targets of the bodies through manual input. A manual target control of the bodies can therefore be set up at defined points. With zenon, the positions of the car bodies and the status of the manufacturing progress within production can be clearly determined.
Display in factory layout
The conveyor system layout is shown in detail in overview screens with current statuses and data. The zenon Worldview function offers the operator different zoom levels with the corresponding level of detail. To help with orientation, the conveyor technology elements are listed in a station list.
Continuous monitoring of production figures
An important task in car body construction is recording production data and calculating the key figures for production monitoring from it. zenon calculates key figures using various needs-based methods, including the integrated IEC 61131-3 programming system zenon Logic. The calculation algorithms are part of the libraries and are connected to the corresponding input and output variables.
OEE metrics (overall equipment effectiveness)
The data recorded and calculated by the system, such as alarms, counter values, process values, calculated values, and shift information, are used to determine the OEE parameters. Formulas are stored in the system for calculating the key figures. A needs-based adaptation to specific requirements is possible.
A typical definition of a formula for calculation is:

The availability factor (A) is a measure of losses due to unplanned equipment downtime. The performance factor (P) is a measure of losses due to deviations from the planned number of pieces due to downtime that was not used to determine the availability factor. Quality Factor (Q) is a measure of losses due to defective or reworked parts.
This allows statements to be made about system availability or production capacity utilization. The zenon reports are carried out in different forms, for example, shift-related to a specific shift, comparison between different shifts, availability related to individual equipment units, and availability related to entire production groups.
On the basis of the downtime-relevant alarms, the number of pieces lost can be determined, i.e. zenon calculates how many vehicles could not be produced due to downtime. The calculation is based on cycle time and downtime. The technology-wide evaluation of body losses in production is called up via a filter for equipment, time, and shift schedule.
Energy and media consumption
The monitoring of utility and energy consumption for process-relevant equipment and systems serves as a variable for low-emission and efficient production. zenon supports the recording, data processing, visualization, and evaluation of different utilities such as electricity, gas, compressed air, the amount of water supplied, as well as hot or cold water used.
A detailed breakdown of the data is supported by the interdisciplinary use of different technologies and the equipment and areas contained therein. In addition, zenon allows users to assign energy costs to cost centers.
Displaying consumption values transparently provides a basis for reducing costs over the long term. The Energy Management System (EMS) can be used to optimize the energy consumption of manufacturing operations. All recorded consumption values can be displayed online in equipment screens, in table formats, in reports, or as trend curves.
zenon as the basis for successful body construction
The requirements in car body construction in automotive manufacturing are manifold. zenon provides the ideal basis for sustainable integration in production. The flow of information through the simple data distribution system in zenon is a key success factor for consistent control of production. Contact COPA-DATA today for more information about zenon.
