Login (User Login; top right of page) with your web user or complete this form to download.
HTML5 visualization with zenon
Secure access to important production information

HTML5 visualization in zenon enhances your access to important process data and information. Users appreciate the familiar browser environment, while creators of visualization projects benefit from proven zenon technology.
Access to process information directly in the browser
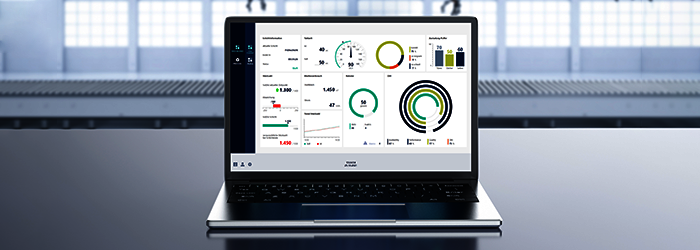
Visualization with HTML5 provides users with a simple way to display important information in a familiar web environment. Key figures and process information are easily accessible via smartphone or tablet. HTML5 visualization is integrated in zenon and is a state-of-the-art add-on for your end-to-end SCADA application. It enables users to visualize production-related information. Features include display of process images, dashboards, KPI-monitoring, and more. HTML5 screens extend the portfolio of mobile access options so users can easily access the most important production information. All browsers that support HTML5 can be used and the application in zenon is browser-agnostic.
Configuration of HTML5 visualizations and process overviews
Dynamic HTML5 content can be generated directly from a zenon project. The informative dashboards and process overview can be generated similarly with little effort. No additional software is needed to display the visualization design. The familiar features and tools from zenon Engineering Studio are available. No installation or configuration on the end device is required.
As of zenon 11, Service Engine can provide your visualization directly as HTML5 content using the Web Visualization Service (WVS). Configuration and operation of your machines and equipment rely on proven zenon technology, while you benefit from an HTML5 application for easy access to visualizations.
As an alternative, HTML Web Engine supports visualization in a cloud environment, with data communication via zenon IIoT Services. The native zenon technology reliably maps the production process.
Security of HTML5 projects
HTML visualization supports secure authentication and requires entry of username and password. The zenon user authentication and integrated Active Directory technology ensure secure user access and protect against unauthorized access to data. User levels can be set so that certain information is only issued to targeted user groups. User rights can be allocated at object level. Network communication is secured via HTTPS and SSL certificates.
Fast Facts
- Display of process images, dashboards and key figures in the browser
- Configuration in zenon Engineering Studio; no further software necessary
- Proven zenon technology as cornerstone of production processes
- User authentication and latest security standards


